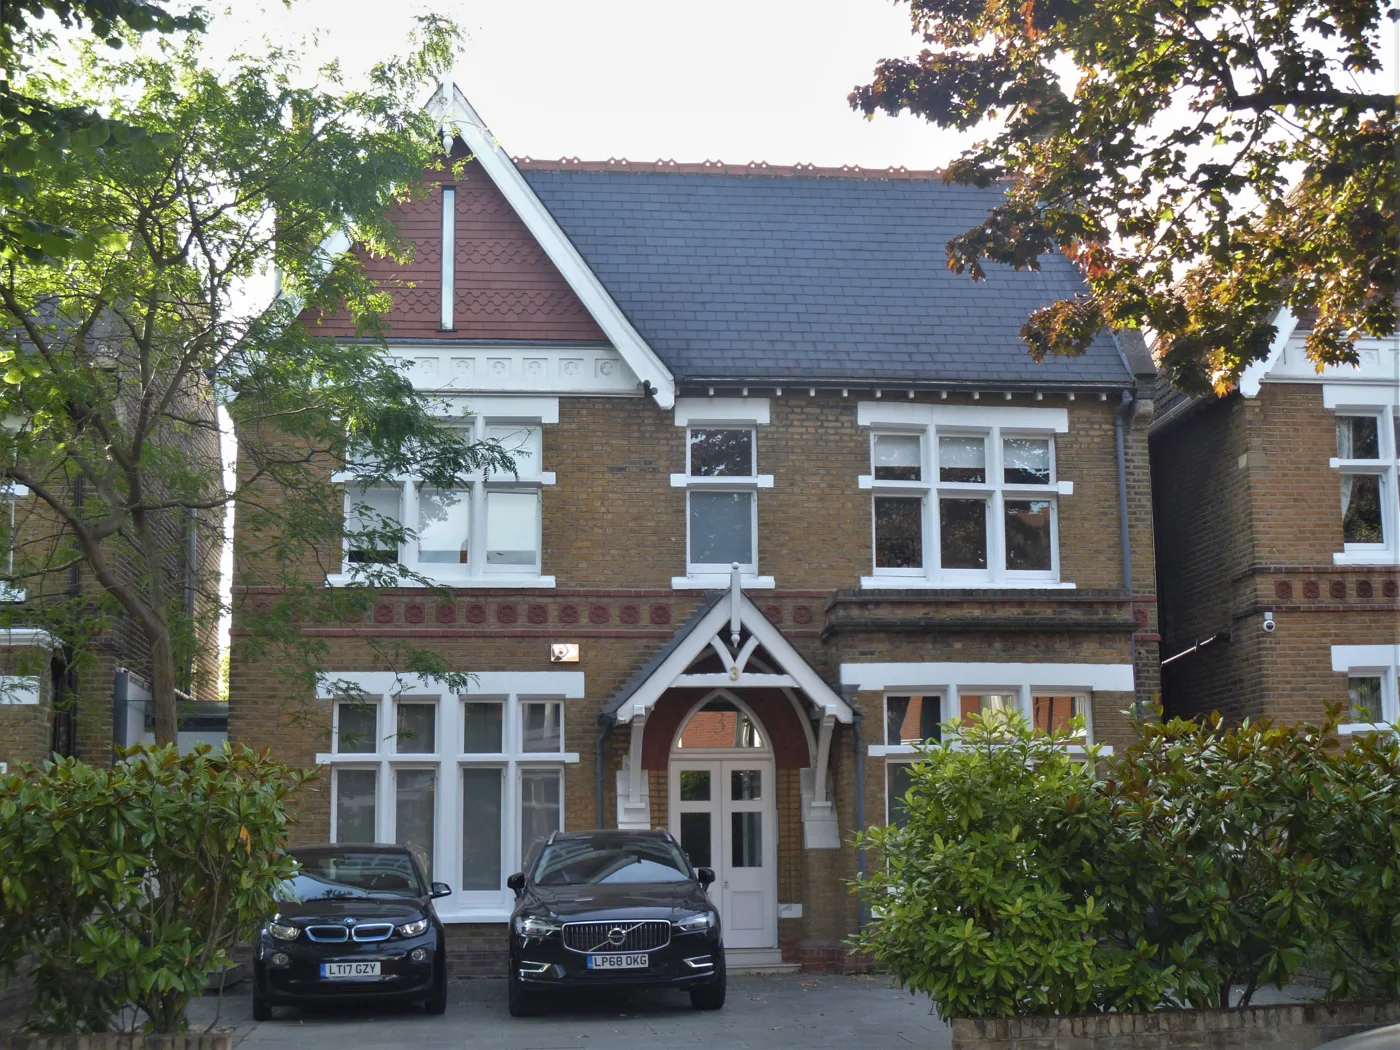

The typical Ealing home sold for £525,000, from 1,733 Land Registry sales. Ward medians run from £800,000 in Walpole to £337,500 in Greenford Broadway.
Two official records tell you what a home in Ealing is worth, and they answer different questions. The UK House Price Index gives a borough average adjusted for the mix of properties sold, which is the number to watch if you want to know which way the market is moving. HM Land Registry’s Price Paid record gives every completed sale, which is what lets you see the gap between Walpole and Greenford Broadway. This page uses both. No asking prices appear anywhere in it.
What an Ealing home actually sold for
Across the year to June 2026, 1,733 homes sold in the borough at a median price of £525,000. That is the middle sale: half of Ealing’s homes went for less, half for more. The mean was £629,690, pulled up by a small number of very large detached houses on the Hanger Hill and Ealing Broadway side of the borough.
Those figures come from HM Land Registry’s Price Paid data, filtered to the Ealing local authority district and to standard market transactions only. Sales registered between 1 August 2025 and 26 June 2026 are included. Registration lags completion by weeks, so the most recent months are thin and will fill in: August 2025 has 248 sales on the record, June 2026 only 54.
The spread is wide. A quarter of Ealing sales came in under £380,000, and 27.2% went for less than £400,000, almost all of them flats. At the other end, 12.2% of sales passed £1 million, and the upper quarter starts at £752,000.
| Property type | Sales | Median price |
|---|---|---|
| Detached | 51 | £1,500,000 |
| Semi-detached | 275 | £730,000 |
| Terraced | 576 | £650,000 |
| Flat or maisonette | 831 | £394,550 |
That table explains the borough in one go. Flats are 48% of everything that sells here, and at a median of £394,550 they are what holds the overall figure down to £525,000. Step up to a terraced house and the median is £650,000, a jump of £255,450. Ealing does have a middle rung that inner London mostly lacks: the semi-detached market is 275 sales a year at £730,000, so the step from terrace to semi is smaller than the step from flat to terrace.
Detached houses are the outlier. Fifty-one sold in a year, at a median of £1.5 million, roughly triple the borough median.
Ward by ward
The borough median hides a range of £462,500 between its priciest and cheapest wards. These medians come from the same Land Registry pull, with every sale’s postcode mapped to its ward through postcodes.io. Wards with fewer than 15 sales are not shown, which this year means Southall Broadway.
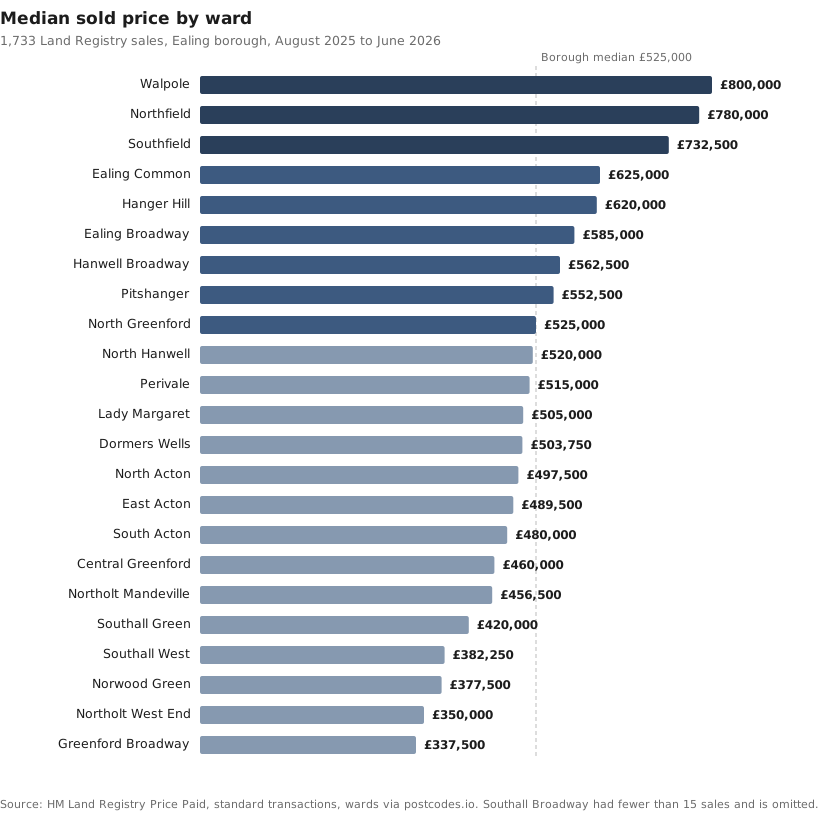
Walpole (£800,000), Northfield (£780,000) and Southfield (£732,500) are the top three, and they are the three wards where the housing stock is most heavily whole Victorian and Edwardian houses rather than converted flats. Walpole covers the streets between Ealing Broadway and West Ealing station; Northfield runs south towards Northfields and Little Ealing; Southfield is the borough’s south-eastern corner, the part of W4 that belongs to Ealing rather than Hounslow.
At the other end, Greenford Broadway (£337,500), Northolt West End (£350,000) and Norwood Green (£377,500) sit between £337,500 and £377,500. These are the wards with the most purpose-built flats and the largest social housing estates, and their medians describe the flat market rather than the house market.
A ward median is not a street price. Ealing Broadway ward has a median of £585,000 and also recorded the borough’s largest single sale of the year: £4,500,000 for a detached house on Aston Road, W5, in August 2025. One ward, two housing markets, sharing a number that describes neither.
By postcode
Postcodes cut the borough a different way, and the outcode figures are worth knowing because that is how most people search.
| Outcode | Area | Sales | Median price |
|---|---|---|---|
| W13 | West Ealing | 239 | £725,000 |
| W5 | Ealing | 328 | £598,750 |
| W7 | Hanwell | 167 | £565,000 |
| UB6 | Greenford and Perivale | 218 | £515,000 |
| W3 | Acton | 307 | £500,000 |
| UB1 | Southall north | 88 | £492,690 |
| UB2 | Southall south | 70 | £402,000 |
| UB5 | Northolt | 173 | £400,000 |
One number is missing from that table on purpose. W4 records 116 sales inside the Ealing local authority at a median of £822,500, the highest in the borough, but W4 is mostly Chiswick and Chiswick is in Hounslow. Those 116 are the South Acton and Gunnersbury end of the postcode, which is genuinely ours. If you search “W4 house prices” you will get a number built mainly from another borough’s streets, so check the local authority before you compare.
Which way prices are moving
Here the mix-adjusted index is the better guide, and it is not comfortable reading for sellers. The UK House Price Index put the average Ealing home at £575,814 in June 2026, down 2.7% over the year.
| Area | Average price | Annual change |
|---|---|---|
| Ealing | £575,814 | -2.7% |
| London | £553,870 | -2.5% |
| England | £293,262 | +1.8% |
Ealing is falling at close to the London rate, while England outside the capital is still rising. That pattern has held for most of the past two years: higher interest rates bite hardest where buyers borrow the largest multiples, and London borrows the largest multiples. The practical reading is that an Ealing seller pricing against a 2022 comparable is about £18,000 adrift, since the borough’s all-time peak was £593,867 in December 2022. A buyer has more room to negotiate than at any point since the pandemic. Our news story on the June release breaks the fall down by property type, and the split is wide: flats down 3.9%, terraces down 1.0%.
The two headline figures on this page differ for a reason worth understanding. £575,814 is mix-adjusted, so it answers “what has happened to the value of a typical Ealing home”. £525,000 is the raw middle of what actually changed hands, so it answers “what did people pay”. Both are Land Registry data. They are not in conflict.
New-build sales are a small part of the picture. Twenty new homes registered as standard sales over the year, at a median of £429,300, against £525,000 for existing homes. That gap is about what is being built, mostly flats, rather than about a discount on new property.
What it means for you
If you are buying a first flat, the £394,550 flat median and the £380,000 lower quartile are your real range. Northolt, Greenford Broadway and the UB2 end of Southall are where that money goes furthest.
If you are trading up to a house, budget for the £255,450 step from flat to terrace, and check the council tax band before you commit, since it is a running cost that outlives the mortgage rate you fix today.
If you are selling, the market is down 2.5% year on year. Pricing against a neighbour’s 2022 sale is the most common way to sit unsold.
Transport explains a good part of the ward spread. Walpole and Northfield sit between Ealing Broadway and West Ealing, both on the Elizabeth line, and Ealing Broadway reaches Paddington in ten minutes. Northolt West End and Greenford Broadway are Central line ground, half an hour from Oxford Circus. That difference is priced into the streets around each station. What gets built next, and where, is set by the borough’s emerging Local Plan, which is still at examination.
Frequently asked questions
What is the average house price in Ealing?
The UK House Price Index put the average Ealing home at £575,814 in June 2026. The median of actual completed sales over the year to June 2026 was £525,000, from 1,733 Land Registry records. The first is mix-adjusted, the second is the raw middle sale.
Are Ealing house prices falling?
Yes, slowly. Prices were down 2.7% in the year to June 2026, close to London’s 2.5% fall, while England as a whole rose 1.8%.
What is the most expensive part of Ealing?
Walpole ward, at a median of £800,000, followed by Northfield at £780,000 and Southfield at £732,500. The single largest sale of the year was £4,500,000 on Aston Road, W5, in Ealing Broadway ward.
What is the cheapest part of Ealing?
Greenford Broadway (£337,500), Northolt West End (£350,000) and Norwood Green (£377,500), the wards with the most purpose-built flats.
How much is a flat in Ealing?
The median flat or maisonette sold for £394,550 over the year to June 2026. Flats are 48% of all sales in the borough.
How much is a house in Ealing?
A terraced house had a median of £650,000, a semi-detached £730,000 and a detached house £1,500,000. Only 51 detached homes sold in the whole borough over the year.
Where can I check what a specific house sold for?
Every completed sale in England and Wales is public. Look up a street or an address free on the HM Land Registry Price Paid service.
Sources
- HM Land Registry Price Paid data, filtered to the Ealing local authority district, standard transactions only, sales registered 1 August 2025 to 26 June 2026, for every median, count and percentile on this page.
- postcodes.io for mapping each sale’s postcode to its electoral ward and local authority.
- UK House Price Index, Ealing (HM Land Registry / ONS) for the June 2026 average and annual change.
- UK House Price Index, London and England for the comparison figures.
- HM Land Registry Price Paid search to check any individual address.
Land Registry figures are revised as more sales register. The most recent months undercount and will rise. Check the linked sources before relying on any figure here for a valuation.
Have your say