
Ealing's average home lost £15,787 in a year, to £575,814. Flats fell fastest at 3.9%, terraces barely moved, and only 21 English districts fell further.
The average Ealing home was worth £575,814 in June, down 2.7% on a year earlier. That is £15,787 off the value of a typical borough home in twelve months. The figures come from the UK House Price Index for June 2026, which HM Land Registry published on 19 August.
The annual change has been negative in seven of the past twelve months, and in each of the last four. It is not falling evenly, though. The gap between what happened to a flat and what happened to a terraced house is the real story in this release.
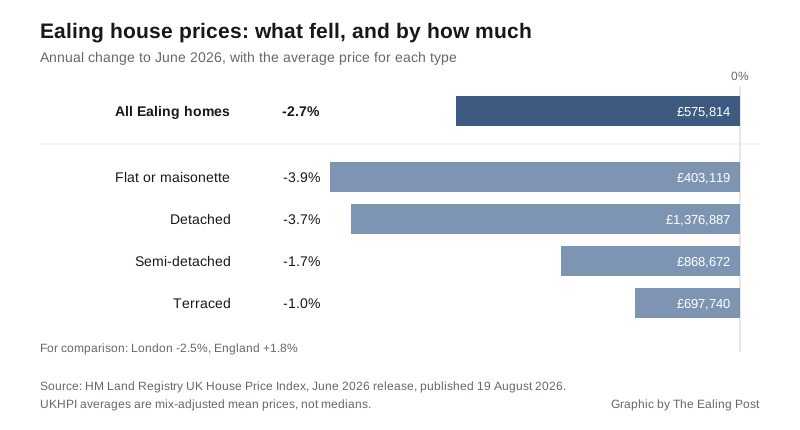
Here is the year to June, by property type:
- flat or maisonette, £403,119, down 3.9%, a fall of £16,271
- detached, £1,376,887, down 3.7%, a fall of £53,441
- semi-detached, £868,672, down 1.7%, a fall of £15,358
- terraced, £697,740, down 1.0%, a fall of £7,221
A flat lost more money over the year than the average Ealing home did, in a borough where flats are what most first-time buyers actually buy. The first-time buyer average is now £482,895, down 2.6% or £12,775.
Where Ealing sits against everywhere else
The whole index ships as a single file covering every local authority, so the borough can be placed exactly rather than guessed at. Across the 295 English districts in the June release, 62 recorded a fall over the year. Only 21 of them fell further than Ealing.
That sounds worse than it is, because the falls are concentrated in one place. The seven steepest in England were all London boroughs: Westminster at 25.4%, the City of London at 20.4%, then Kensington and Chelsea, Hammersmith and Fulham, Tower Hamlets, Islington and Camden. Ealing is a long way down that list, and it is close to the London average.
| Area | Average price | Annual change |
|---|---|---|
| Ealing | £575,814 | -2.7% |
| Brent | £544,174 | -3.4% |
| Harrow | £524,160 | -1.4% |
| Hillingdon | £474,665 | -0.6% |
| Hounslow | £512,888 | +1.1% |
| Hammersmith and Fulham | £725,562 | -13.3% |
| London | £553,870 | -2.5% |
| England | £293,262 | +1.8% |
Ealing remains the 15th dearest of London’s 33 boroughs. It is also more expensive than every one of its immediate neighbours except Hammersmith and Fulham, which is where that borough’s 13.3% fall matters to Ealing sellers. The prime end of west London has repriced hard over the past year, and Ealing’s own detached market, down 3.7%, is the part of the borough nearest to it in price.
Hounslow is the outlier next door. It rose 1.1% while Ealing fell.
June was actually an up month
Prices rose 1.3% between May and June. No month since June 2025 has risen faster. Read that carefully, though. A single month in this index moves on the mix of what happened to complete, and the annual figure still worsened slightly, from 2.6% to 2.7%.
The index is also revised every month as more sales register. May was first published on 22 July at £568,887 and a 2.5% annual fall. In this release the same month reads £568,482 and 2.6%. April moved the other way, from £564,242 to £565,318. Both revisions are small, which is what a settled market looks like. The direction has not changed.
At £575,814, Ealing is £18,053 below its all-time peak of £593,867, set in December 2022. That is a fall of 3.0% over three and a half years, before inflation.
The sales figures lag, and 2025 distorts them
Sales volumes are the part of this release that cannot be read straight. Land Registry withholds the count for the most recent two months, so the latest publishable figure for Ealing is 116 sales in April 2026, against 157 in March.
Those look low against last year, and there is a reason that has nothing to do with demand. The stamp duty nil-rate thresholds fell back on 1 April 2025, and completions were pushed through to beat the deadline. Ealing recorded 537 sales in March 2025 and 93 in April 2025. Comparing this spring with that one measures the deadline, not the market.
What it means for you
If you are selling, price against this year, not against 2022. A terraced house is the strongest position in the borough right now: terraced values are down 1.0%, the shallowest fall of the four types. A flat is the weakest, and a large detached house has lost the most in cash terms by a distance.
If you are buying a first home, the average Ealing flat costs £16,271 less than it did a year ago, and the first-time buyer average is down £12,775. That is a real change to a deposit, and it is worth checking against actual completed sales in the streets you are looking at rather than against asking prices. Our Ealing house prices page has the ward-by-ward and postcode medians from the Price Paid record.
If you are remortgaging, a 2.7% fall over a year can shift a borderline loan-to-value band on a home bought near the 2022 peak. Ask the lender for a fresh valuation rather than assuming the purchase price still stands.
One number to treat with care. The UK House Price Index average is a mix-adjusted mean, not a median. It is designed to track the value of a typical home over time, so it is the right measure for “which way is this going” and the wrong one for “what will I get”. The middle of what actually changed hands in the borough is lower.
The July 2026 index is published at 9.30am on 16 September.
Sources
- UK House Price Index, Ealing, June 2026 (HM Land Registry), for every Ealing average, annual change and monthly change on this page.
- UK House Price Index reports collection (HM Land Registry), for the 19 August 2026 publication date and the 16 September date for July.
- UK HPI full file, June 2026 (HM Land Registry), for the comparison with all 295 English districts, the London borough figures, the sales volumes and the December 2022 peak.
- UK HPI full file, May 2026 (HM Land Registry), for the April and May figures as first published, used to measure the revisions.
Have your say